Records Analytics
Dashboards computed on demand over finalized records. A group-scoped viewer sees only the records they can open; department administrators see the whole department. Every dashboard takes a date range and an optional station group.
Feature flag: Records.Analytics. Menu: Records → Analytics.
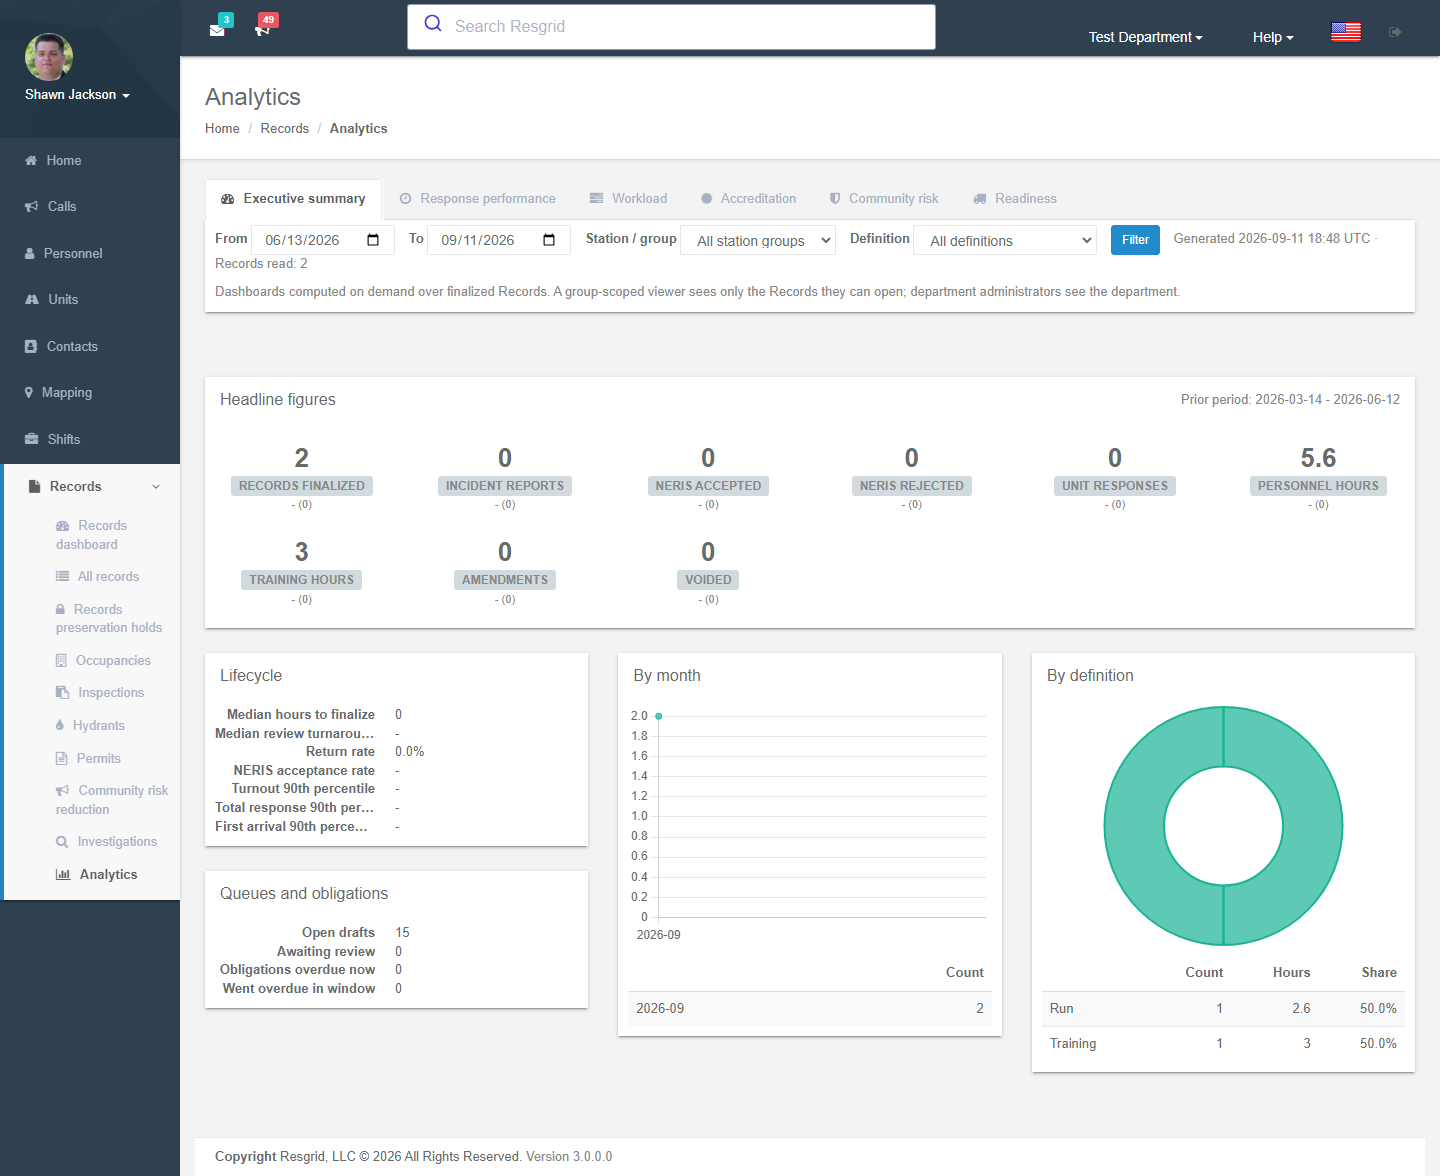
Dashboards
| Dashboard | What it answers |
|---|---|
| Executive summary (Index) | Headline figures: records finalized, incident reports, personnel hours, NERIS acceptance rate, queues and obligations (open drafts, awaiting review, overdue now, went overdue in window), lifecycle counts (amended, voided, cancelled), records by weekday and hour heat-map, prior-period comparison. |
| Response performance | Turnout, travel, total response and first-arrival times (average, median, 90th percentile) with configurable turnout / travel targets in seconds and the share within target; by call type, incident type, station group, hour of day and month; time on scene and unit hours on scene. |
| Workload | Records by definition, by person, by unit and by station group; personnel hours and hours per member; training records and hours; median hours to finalize; median review turnaround; return rate. |
| Accreditation | The figures accreditation bodies (e.g. CFAI) ask for: response-time compliance against targets, training hours, inspections completed on schedule, hydrants tested within 12 months, occupancies inspected within 12 months, CRR audience reached. |
| Readiness | Composed from Checklists, Work Orders and Inventory (each module authorizes you itself): checklist completion and on-time rate, expected/missed checks by day, unit readiness board, work orders open by priority and age, mean time to repair, safety holds, equipment issued / out for repair / expiring within 30 days, readiness packets captured. |
| Community risk | Occupancy risk profile (hazmat on site, no sprinklers, vacant, occupants needing assistance), inspections pass rate and days to correction, open violations by severity, permits issued / denied / expired, hydrants by flow class and tested within 12 months, CRR activities and audience. |
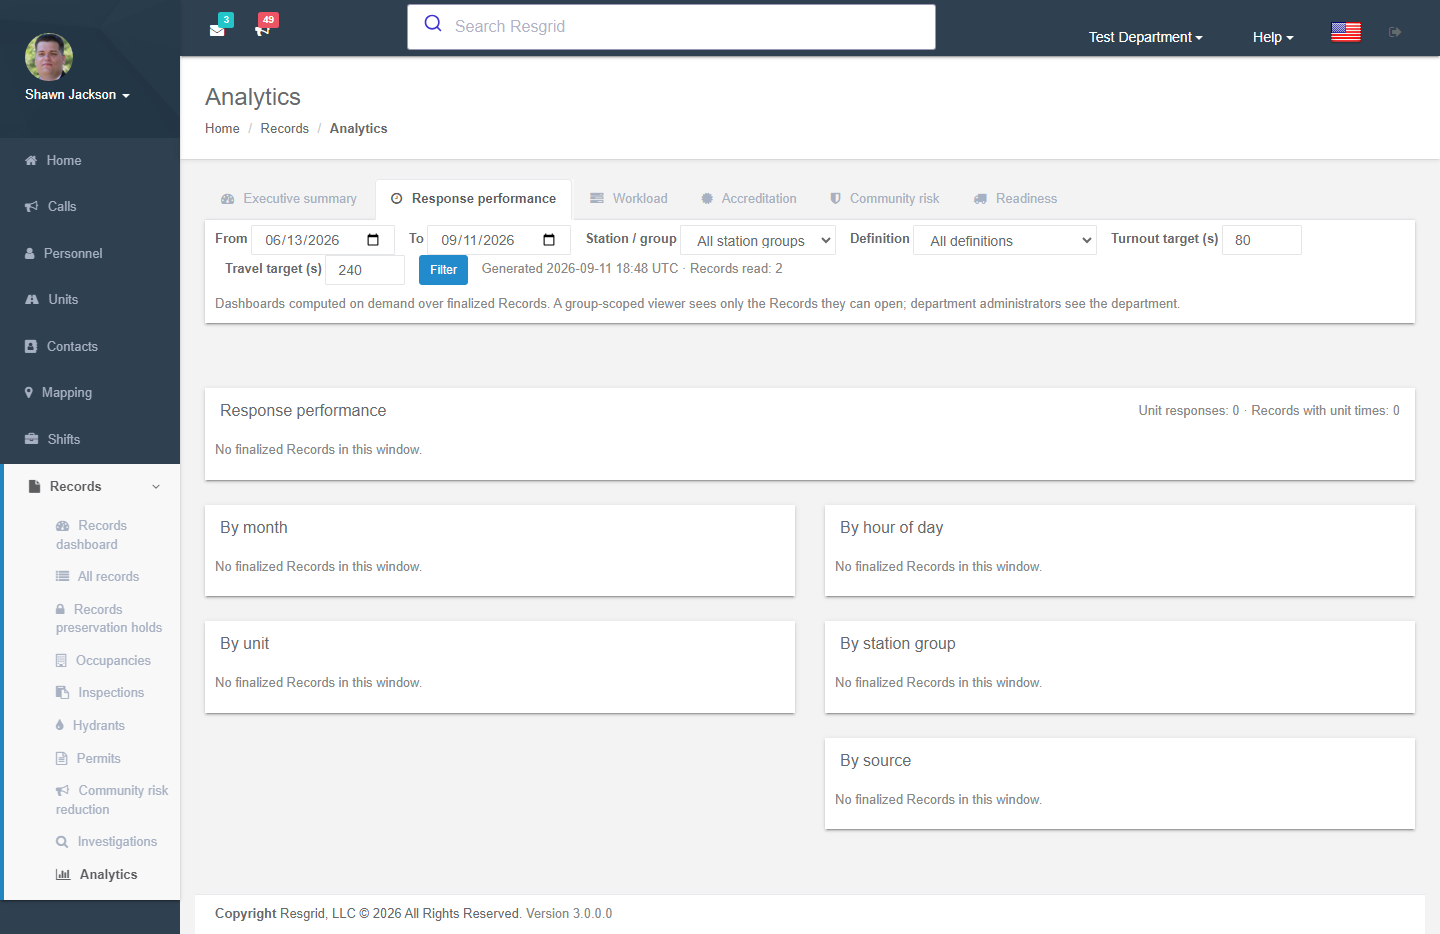
Each dashboard can be printed; underlying rows come from saved reports when you need the data itself.
Setup tips
- Response performance needs unit times on records (dispatched / en route / on scene). Departments using the Unit app get these automatically; otherwise enter them on the Run or incident report.
- Set your turnout and travel targets once (they persist in the URL you bookmark) to match your standard of cover.
- Readiness figures are empty until Checklists / Work Orders / Inventory are in use.
Technical reference
| Item | Value |
|---|---|
| Routes | /User/RecordsAnalytics/{Index,ResponsePerformance,Workload,Accreditation,Readiness,CommunityRisk}?start=&end=&stationGroupId=&definitionKey=&turnoutTargetSeconds=&travelTargetSeconds= |
| Service | IRecordsAnalyticsService (computed on demand; no materialized cubes) |
| Flag | Records.Analytics (module says This module is not enabled when off) |